How to start and perform the process
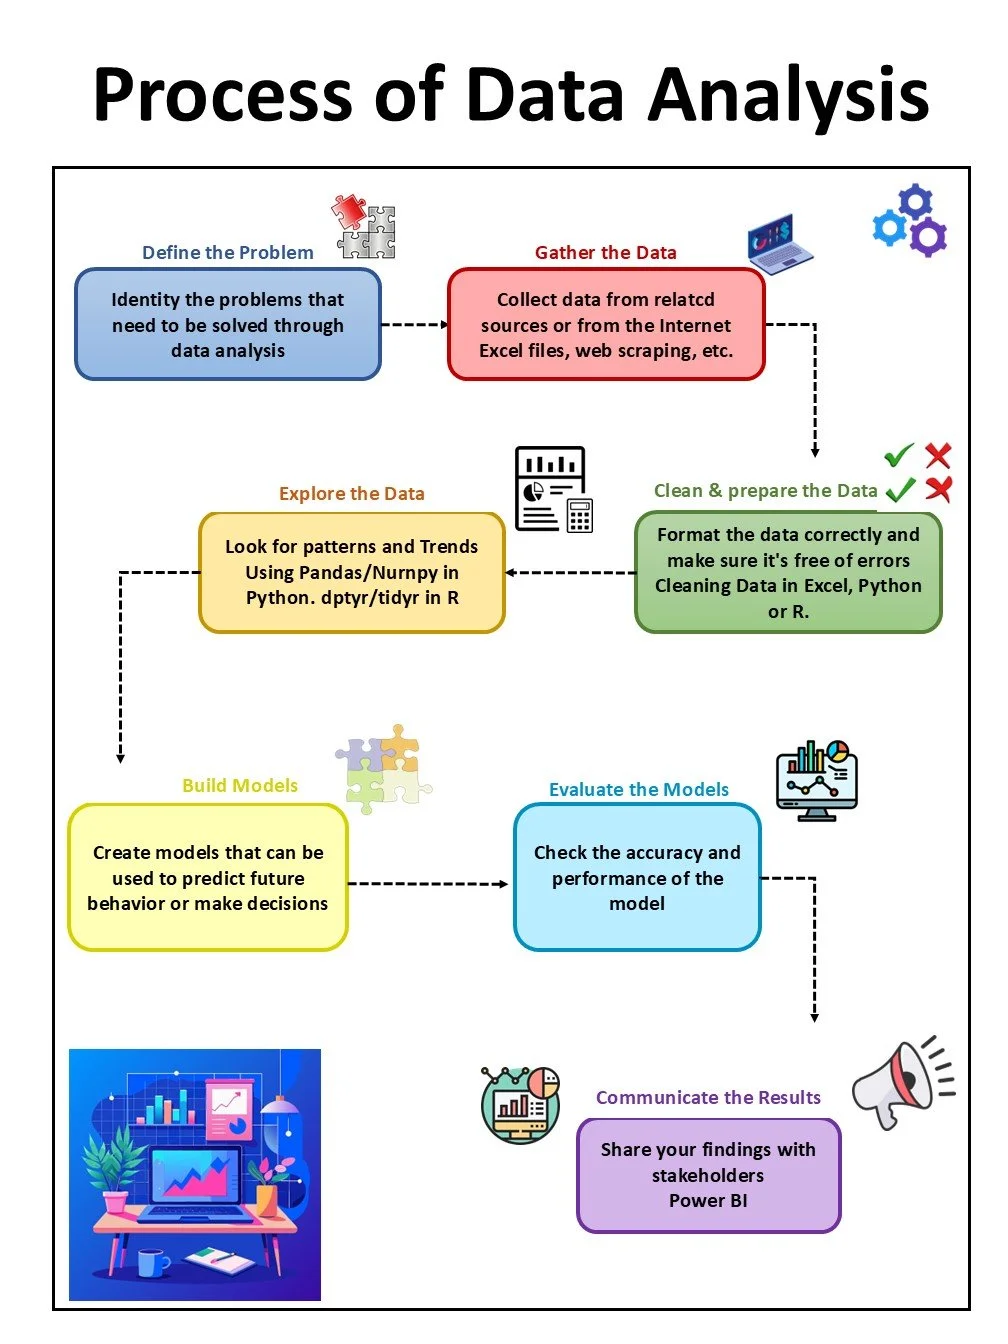
Define the Problem:
What figures/KPI shall be presented?
What questions shall be answered?
What data or process dependencies shall be visualized?
What are the desired time intervals in the report?
Time def. in date handling (fiscal vs reg. year)?
Who are the receipiants of the report?
What security/trust levels are required?
Mobile access desired?
Clean & Explore the Data
Perform data analysis
Correct problems
Communicate the results
Gather the Data
Adapt data source /e.g. SPIRE by Spire-Systems)
What custom-defined SPIRE-fields do exist?
What other data sources are required?
How are they connected with SPIRE (Keys)?
Setup other data sources
Perform data analysis
Define data-types
Define connections
Built data model
Adapt the Model
Adapt changes in measures and udf-Fields
Adapt the layouts and colors
Adapt visuals
Testing
Technical
Content/Figures
Updating